An Automated Measurement of Subcortical Brain MR Structures in
Schizophrenia
Dan V. Iosifescu1, Martha E.
Shenton1, Simon K. Warfield3, Ron
Kikinis2,
Joachim Dengler4, Ferenc A.
Jolesz2, and Robert W. McCarley1
1 Clinical Neuroscience Division, Laboratory of
Neuroscience, Department of Psychiatry, Harvard Medical School, Brockton VAMC,
MA;
2 Surgical Planning Laboratory, Department of Radiology, MRI Division, Brigham and Women's Hospital, Boston, MA;
3 School of Computer Science and Engineering, The University of New South Wales, Sydney, Australia;
4 German Cancer Research Institute, Heidelberg,
Germany.
Corresponding author: Martha E. Shenton, Ph.D., Brockton
VAMC, Psychiatry (116A), 940 Belmont Street, Brockton, MA 02401, tel. (508)
583-4500 X 1508, fax (508) 580-0059, e-mail:
martha@bwh.harvard.edu
Presented in part at the 81-st Scientific Assembly
and Annual Meeting of the Radiological Society of North America, Chicago, IL,
November 1995, at the Annual Convention of the Society of Biological Psychiatry,
New York, NY, May 1996, and at the Annual Meeting of the American Psychiatric
Association, New York, NY, May 1996.
This research was supported by the
Medical Research Service and Brockton Schizophrenia Center of the Department of
Veteran Affairs and a Senior Investigator Award from the National Alliance for
Research in Schizophrenia and Depression (Dr. McCarley); by grants R01-40799
(Dr. McCarley), 1K02 MH-01110-01 and 1R29 MH-50747-01 (Dr. Shenton) from the
National Institute for Mental Health; by the Commonwealth of Massachusetts
Research Center (Dr. McCarley); by the Scottish Rite Foundation (Dr. Shenton);
and by an Australian Postgraduate Award (S. Warfield).
ABSTRACT
An automated registration
algorithm was used to elastically match an anatomical magnetic resonance (MR)
atlas onto individual brain MR images. Our goal was to evaluate the accuracy of
this procedure for measuring the volume of MRI brain structures. We applied two
successive algorithms to a series of 28 MR brain images, from 14 schizophrenia
patients and 14 normal controls. First, we used an automated segmentation
program to differentiate between white matter, cortical and subcortical gray
matter, and cerebrospinal fluid. Next, we elastically deformed the atlas
segmentation to fit the subject's brain, by matching the white matter and
subcortical gray matter surfaces. To assess the accuracy of these measurements,
we compared, on all 28 images, 11 brain structures, measured with elastic
matching, with the same structures traced manually on MRI scans. The similarity
between the measurements (the relative difference between the manual and the
automated volume) was 97% for whole white matter, 92% for whole gray matter, and
on average 89% for subcortical structures. The relative spatial overlap between
the manual and the automated volumes was 97% for whole white matter, 92% for
whole gray matter, and on average 75% for subcortical structures. For all pairs
of structures rendered with the automated and the manual method, Pearson
correlations were between r = 0.78 to r = 0.98 (p < 0.01, N = 28), except for
globus pallidus, where r=0.55 (left) and r=0.44 (right) (p < 0.01, N = 28).
In the schizophrenia group, compared to the controls, we found a 16.7% increase
in MRI volume for the basal ganglia (i.e., caudate nucleus, putamen and globus
pallidus), but no difference in total gray/white matter volume, or in thalamic
MR volume. This finding reproduces previously reported results, obtained in the
same patient population with manually drawn structures, and suggests the
utility/efficacy of our automated registration algorithm over more labor
intensive manual tracings.
INTRODUCTION
The quantitative analysis of
magnetic resonance imaging (MRI) data to examine anatomical brain structures is
a fundamental component in the assessment of structural brain abnormalities [23],
in mapping functional activation onto human anatomy [8],
and in computer-assisted neurosurgery [19]).
Such analyses are important in structural MRI studies of schizophrenia,
dementia, and other brain diseases, where very high precision in measurement is
required, due to small, subtle volumetric differences between brain regions in
patients and in normal control subjects. Moreover, some of those brain disorders
(e.g., schizophrenia) involve volumetric changes in several brain regions
simultaneously and an ideal study should be able to address all those changes in
the same patient population. However, the method currently used for analyzing
those differences involves a laborious manual tracing of the contours of
anatomical structures derived from MRI scans. Using manual tracing, the
resulting time requirements make it practically impossible for a research team
to measure more than a limited number of brain structures in a patient
population and in a matched control group. An automated procedure would thus
greatly increase both the number of regions as well as the number of individuals
who could be investigated in any one study.
An automated technique for
quantitative MRI analysis would have to be able to differentiate between
structures with similar intensity on the MRI scans. One solution would be to use
an anatomical atlas as a template, in order to provide anatomical information
not obvious from MR contrast alone. Several digital atlases have, in fact, been
developed in the last decade, in order to solve this problem, one of the best
known being the atlas established by Höhne and coworkers [16].
In the current study, we have used an MR brain atlas, developed in our
laboratory [19],
[24]
in order to evaluate, and compare, our automated registration algorithm for the
volumetric measurement of MRI brain structures, to the same measurements
performed using manual tracing. Accordingly, we took information from the MR
brain atlas, based on one control subject, and projected it into other MRI scans
by applying an elastic match (i.e., warping the atlas into the shape of the new
brain image). The global registration technique that we used to match our
anatomical MR atlas onto new MR images, is based on work by Dengler and
coworkers [7],
[22],
[25].
This technique builds on the theory of elastic membranes, and it is similar to
Grenander's approach [13].
The elastic membrane model can be intuitively understood as the
deformations occurring when a set of points on the membrane is stretched. In
this context, the atlas brain can be compared to a rubber brain, which is
stretched and compressed non-linearly in order to match the contours of the new
brain. At the end of the registration, all the structures previously defined for
the atlas brain are also defined for the new brain image. The general hypothesis
underlying this method is that the topology of cerebral structures remains an
invariant, which means the differences between individuals may be considered as
variations in the shape of a common underlying plan (the atlas).
As we
report in this study, we were able to measure, with high accuracy, the volumes
of eleven brain structures using elastic matching. (These brain structures
included: total brain volume, total gray matter, total white matter, left and
right thalamus, left and right caudate, left and right putamen, and left and
right globus pallidus.) This technique also allows for the study of larger
groups of patients, due to the remarkable increase in speed over manual tracing.
Therefore, using elastic matching, as we will describe in this study, can
increase the possibility of highlighting subtle morphological changes associated
with schizophrenia and other chronic brain disease.
METHODS
Subjects
Fourteen chronic schizophrenia patients, from among the patients of
the Brockton VA Hospital, and fourteen normal controls were selected and matched
for age, gender, handedness and parental socioeconomic status. The inclusion
criteria for all subjects were:
The exclusion criteria for normal controls were no personal or familial
history of mental disorder (for further subject characteristics see [23]).
MR Image Processing
MRI Acquisition: The MR images were acquired on
a 1.5-Tesla General Electric Signa System (GE Medical Systems, Milwaukee).
Sagittal localizer images were acquired, followed by three-dimensional
Fourier-transform (3DFT) spoiled-gradient-recalled acquisition (SPGR), with a
repetition time of 35 msec, an echo time of 5 msec with one repetition, a flip
angle of 45 degrees, a field of view of 24 cm, and a matrix of 256 by 256 (192
phase-encoding steps, with zero filling) by 124. The data were stored and
analyzed as 124 coronal slices of 1.5 mm thickness. Voxel dimensions were 0.9375
X 0.9375 X 1.5 mm. To reduce flow-related artifact from cerebrospinal fluid
(CSF) and blood, presaturation of a slab inferior to the head was performed.
Following MR acquisition, we used a noise filtering program [12].
This program and all image processing methods described in the following are
implemented on SPARC workstations (Sun Microsystems, Mountain View, California)
and have been successfully used for a number of studies in our laboratory [23],
[17],
[27].
Manual
Region of Interest (ROI) Definition by Experts: We used the measurements for
basal ganglia volume published by Hokama and coworkers [17].
These measurements included: left and right caudate nucleus, left and right
putamen, and left and right globus pallidus. For thalamus (left and right)
measures, we used the values obtained by Portas et al. (1997, submitted for
publication). Both studies were done on the same set of MR brain images that we
used for the automated method. (Measures of whole brain volume, as well as gray
and white matter volume were computed using automated segmentation algorithms --
see below -- , whereas the smaller ROI's were traced manually by raters.) The
intra-rater reliability in the basal ganglia study (where the editing was done
by a single rater), measured as the percent error, was 0.5% and 0.5% for globus
pallidus, 2.0% and 3.2% for putamen and 4.3% and 4.4% for caudate. In the study
of thalamic volume by Portas and coworkers, the inter-rater reliability (mean
intraclass r) was r = 0.910, based on three brain images, edited by three
raters. For the intra-rater reliability, the percent difference was 4.55%. We
therefore considered the results from both studies to be a reasonable standard
for comparison purposes.
Automated Segmentation: A
comprehensive description and validation of the tissue classification procedure
we used has been published by Wells and coworkers [26].
In the first series of segmentations, we used the classification algorithm to
segment SPGR voxels for the entire brain into white matter, gray matter, and
CSF. In a second series, we segmented those same voxels into cortical gray
matter, subcortical gray matter, white matter, and CSF. The segmentation
algorithm allowed the operator to choose representative pixels for each tissue
class. Those points were chosen in one brain image and then we used the same
values for all other 27 brain images. We defined subcortical gray matter by
choosing approximately 20 representative voxels in the best defined regions from
the center of the thalamus and putamen, over one or two MR slices. The automated
program was then able to classify the rest of the voxels. We also segmented the
skin, which was used in the initial registration stage (see below, under linear
registration).
This fully automated algorithm used a priori knowledge of
tissue properties and intensity inhomogeneities in order to correct for those
intensity differences in the MRI data (Wells et al., 1996). Only the segmented
tissue class data was used for the elastic matching. Working with segmented data
improved the robustness of the elastic matching algorithm to noise effects and
it increased the speed of the matching.
There was no relationship between the
spatial location of the chosen training points and the accuracy of the
segmentation or of the subsequent elastic match. At the segmentation level, the
tissue classification was voxel independent and the spatial location of the
training points has no effect on the recovered classification [26].
The key criterion in the training step was to model the distribution of signal
intensities. Only the variation of signal intensities made any difference.
Therefore, selecting training points with identical signal intensity, but at
different spatial locations had no effect on the statistical model for the
distribution of tissue classes, and resulted in no changes in the
classification. Training points with different signal intensities leaded to a
different statistical model for the distribution of tissue classes. This, in
turn, may or may not have lead to a different classification, depending on
whether feature space boundaries were altered.
Definition of Subcortical
Gray Matter: For the second series of segmentations, the automatic
segmentation algorithm misclassified some of the cortical gray matter as
subcortical gray matter, due to the similarity in MRI signal intensity. In order
to partially eliminate the misclassified subcortical gray matter from the
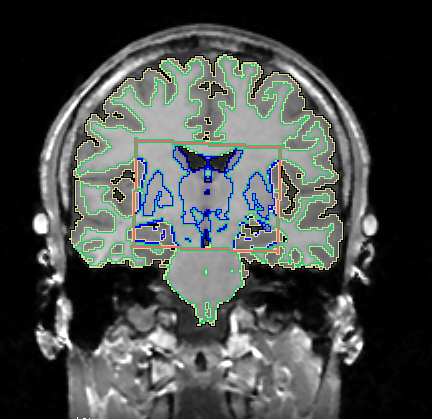
subsequent match, we outlined a rectangular volume (seen as a rectangle in Figure
1). Its borders were defined as to include the entire subcortical areas. It
also included some cortical areas (e.g., insular cortex), since we tried to keep
to a minimum the amount of manual editing involved. The rectangular volume was
manually outlined on the atlas image and it was then linearly registered into
each new patient image. Within this rectangular space we included all tissue
classified by the segmentation algorithm as subcortical gray matter as a target
for the matching program. Within this rectangular space we included all tissue
classified as subcortical gray matter as a target for the matching program. The
rectangular volume was manually outlined on the atlas image and it was then
linearly registered into each new patient image. We used as the posterior border
the most posterior coronal MRI slice where the temporal horns were separated
from the main body of the lateral ventricles. The anterior border was defined as
the most anterior MRI slice containing a part of the lateral ventricles. The
inferior border was taken as a horizontal line drawn through the inferior tip of
the third ventricle and, more anteriorly, the superior tip of the inferior
interhemispheric sulcus. The superior border was taken as the roof of the
lateral ventricles. The lateral borders were chosen as the gray matter of the
insular lobe, on both sides. In Figure
1, we present the outlining of those borders on an actual MR image. The
operation was important in order to target the elastic matching algorithm
towards a specific brain area and to eliminate the misclassified tissue from the
match. We want to emphasize, however, that those borders did not contain
anatomical information, nor did they represent anatomical landmarks which the
computer was supposed to match, as in the method of Evans and coworkers [10].
Figure 1: An example of the segmentation into cortical
white matter (yellow borders), white matter (green borders), and subcortical
gray matter (blue borders). The area within the orange rectangle was segmented
into cortical and subcortical gray matter, whereas the area outside the
rectangle was segmented using a single tissue class for the gray
matter.
Linear Registration:
The first step towards matching the atlas brain image onto a new brain image
(patient) was to use a linear registration program to correct for the
differences in size, rotation and translation between the two brain images [9].
The linear registration performs a gross alignment of the two three dimensional
(3D) data sets, through a combination of energy-minimization registration
techniques. The bases of the registration were the 3D surfaces extracted from MR
images. In the first step, the system extracted the 3D surface points
corresponding to the skin in the segmented images from the atlas brain and from
the patient brain. The subsequent linear transform was computed on those skin
surfaces and then applied to the atlas brain. The final product was an atlas
brain image linearly registered onto the patient brain image.
Elastic Matching: We summarize here
some technical details of Dengler's regularization procedure [7],
[22],
which we used to map 3D MR images onto each other. (For a more detailed
discussion on the mathematical model underlying the algorithm, please see the
Appendix.) The goal of the elastic matching algorithm was to find a 3D
deformation vector field which transformed the source data set (segmented atlas)
so that it matched the target data set (segmented patient image). The
deformation field maximized the local similarity between the two data sets. In
Figure
2, we present a schematic example to illustrate the principle of the warping
process and the elastic deformation of the MR image.
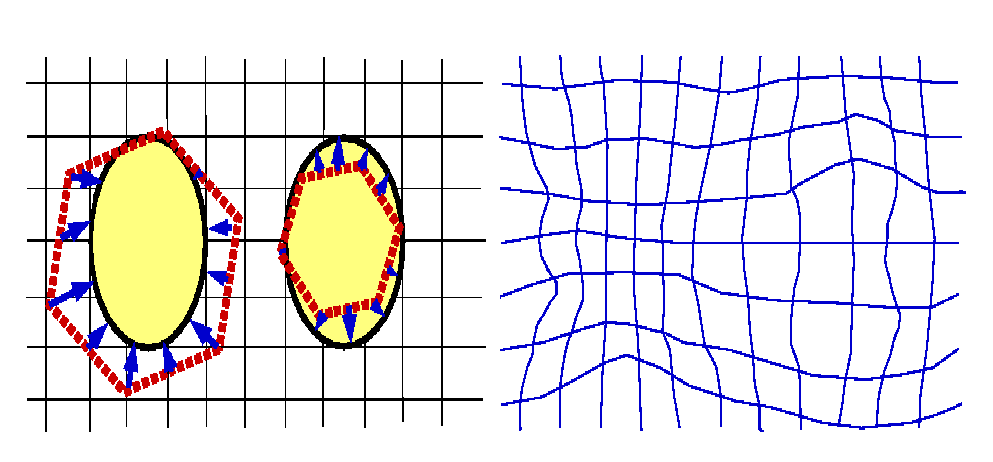
Figure 2: Schematically, an "atlas" image (the red
hexagon) is mapped onto a new "patient" image (yellow oval).A simple uniform
global displacement (translation, rotation or scaling) does not work. Instead,
we used a procedure that "warped" the "atlas" image onto the "patient" image.
This warping resulted in a "vector field" (blue arrows). The non-uniform
displacement of each pixel is then represented in the right field, by means of
the deformation of the rectangular grid (the elastic membrane).
The
elastic matching is volume based, with the forces driving the atlas and patient
together being derived from the mismatch of the boundaries of the structures.
The elasticity constraint is a global 3D regularization that applies to every
voxel in the data set. A mapping between two MRI images
required defining the full vector field (i.e., displacement of each voxel); this
was an "ill-posed" problem since displacement information was present only where
there was structure in the images, and the number of voxels accounting for
structure was much less than the total voxel number. This occurred with the
dimensional increase or decrease in the regions of interest. For example,
schizophrenics had increased basal ganglia volume compared with normal subjects.
In this case, the mapping of a larger to a smaller volume involved a
"many-to-fewer" mapping of voxels. Thus a region of, say, 100 voxels was mapped
onto an 80 voxel region. An intuitive way to understand Dengler's (Dengler et
al., 1988; Schmidt and Dengler, 1989) solution is to consider it as involving a
rather detailed mapping of regions where there is important information (e.g.,
edges), while interpolating in regions where there is little information (e.g.,
large isodense gray matter zones).
The segmented MRI data was
interpolated to form a data set with isotropic voxel size. The finest spatial
scale of the matching was set by selecting a Gaussian filter sampled to a size
of 9x9x9 voxels at this resolution. This same filter was applied through a
multiresolution pyramid, so that at each level of the pyramid a fixed width
window was used, but this corresponded to different spatial scales. In the
current implementation we used a three level pyramid.
The algorithm was
completely automated; the only user input was the selection of the segmented
tissue classes as variables in the matching procedure. The values
assigned depended, in general, on the stage of the registration and were
empirically determined. We used only the skin surface for the initial linear
registration, then the white matter and the subcortical gray matter for the
elastic matching. The matching algorithm determines correspondences between
segmented data sets. We currently use a sequence of matches of binary masks to
achieve the overall alignment. The sequence of binary mask matches is designed
to capture different types of local shape deformation at each stage. The first
match involves a mask formed from the white matter. This match captures local
differences in the white matter volumes. To further refine this alignment for
the subcortical gray matter structures, we performed a match of the gray matter
structures inside a mask of the subcortical gray matter region.
The use
of a binary mask essentially equalizes the image gradients, so that every edge
has the same gradient and inside homogeneous regions no gradients arise. The
multiresolution pyramid makes use of low-pass filtered (Gaussian windowed)
segmentations and so in the actual matching process no true step edges are
present; all edges have been smoothed by the low pass filtering
operation.
We further improved the matching results by using the output
of one matching cycle as an input (atlas) for a new matching cycle (iterative
cycles). In the elastic membrane model, at the end of the match cycle we had
a tense and deformed membrane. By removing the tensions and applying a new match
cycle, the membrane was further deformed toward the model. Four iterative
matching cycles were applied for each new patient image.
Data Analysis: We evaluated the accuracy of
each match by comparing, for each case, the volumes of 11 brain structures,
measured both manually and with elastic matching. We computed a coefficient of
similarity between the measurements of MRI volumes, done with the two methods.
This coefficient was defined, for each structure, as 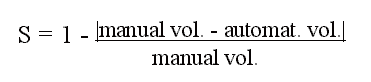
Thus the accuracy was defined
relative to the "true" volume, measured manually. Using the absolute value of
the difference between the two measurements we penalized in the same way either
a larger or a smaller value of the matched volume. For example, if the manually
measured volume had 1000 voxels, the coefficient of similarity was the same
(0.5), whether the matched volume had 500 voxels or 1500 voxels. Furthermore, we
used the absolute value of the difference, so that when added together the
differences will not result in an artificially high similarity. The coefficient
of similarity for each structure was averaged over all 28 cases as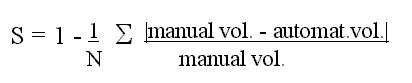
We also measured the
degree of spatial accuracy of the automated algorithm by computing, for
each separate structure, the relative spatial overlap between the manual and
automated volumes:
Two-tailed tests of significance were used for the Pearson and
the Spearman correlations among all 28 cases, which assessed the correlation
between the manual measurements and the results of each cycle of iterative
elastic matching. The correlations were computed separately for the 11
neuroanatomical structures. We also computed the total volume of the basal
ganglia in each case, by adding the volumes of the two caudate nuclei, two
putamen and two globus pallidus.
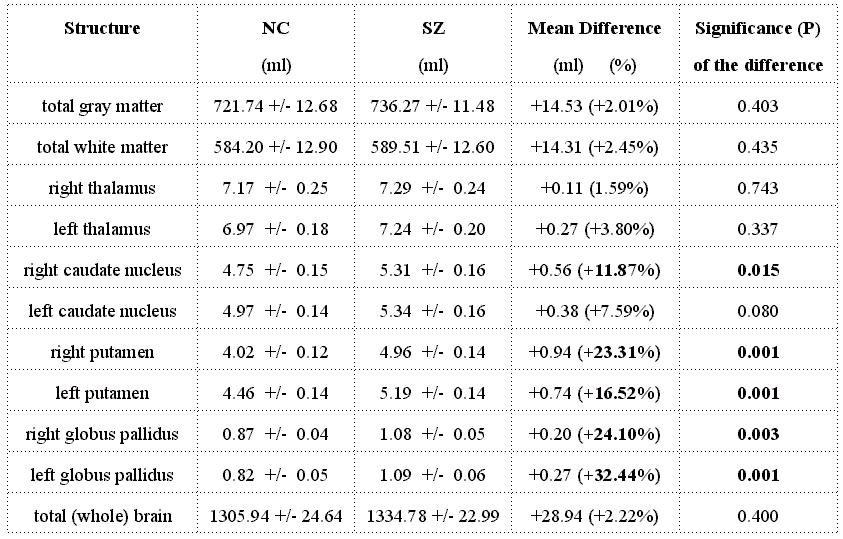
RESULTS
The first set of measurements
were computed on the series of segmentation including the subcortical gray
matter. We present the accuracy of the volume measurements for all 11
brain structures, computed as the similarity between the automated and the
manual method (see Methods section for the definition of the similarity
coefficient). This is followed by a review of the correlation between manual and
automated measurements. Next, we present the spatial accuracy of the
automated algorithm, computed as the percent overlap between structures edited
with the two methods (i.e., automated and manual). We further present the
similarity of the measurements on the series of segmentations not including a
separate tissue class for subcortical gray matter. The entire white and gray
matter were used there as features for the match. We also present the accuracy
of the volumetric measurements for cortical brain structures. Finally, we
present a comparison for the 11 brain structures' volumes between the
schizophrenia patients and the normal controls.
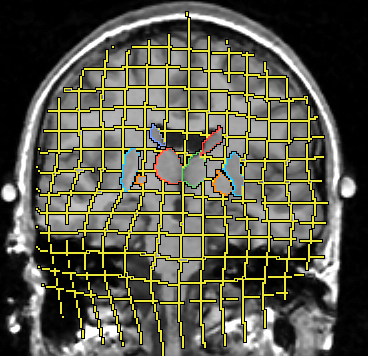
Figure 3:An actual example for the elastic matching.The background is the MR scan of the patient. We outlined the contours of the basal ganglia, taken from the warped atlas. The grid (yellow) was rectangular in the atlas coordinates, and its deformation illustrates the warping process. Please compare with the schematic presentation in Figure 2.
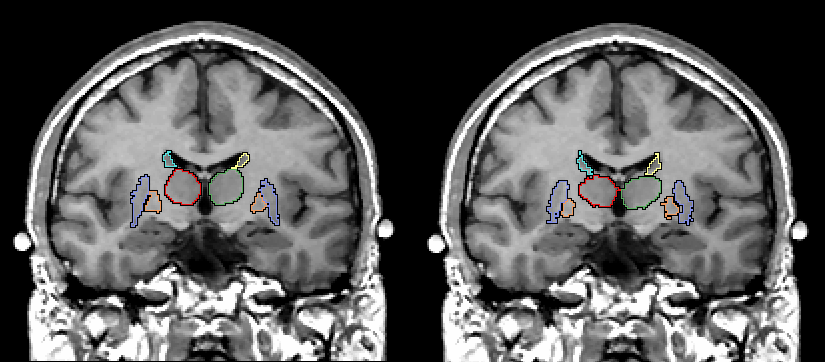
Figure 4:The only gold standard we had for the elastic
matching algorithm were the manually edited basal ganglia and thalamus. On the
left is one MRI slice showing the manually edited basal ganglia and thalamus. On
the right is the same slice but here we see the results of the basal ganglia and
thalamus depicted using the elastic matching program.
For an actual
example, Figure
3 presents the automated outlining of the basal ganglia on an actual MR
coronal slice. The deformation of the yellow grid illustrates the warping
process. Figure
4 shows a comparison, on one slice (i.e., in two dimensions), between the
manual edited basal ganglia and thalamus (on the left) and the automatic
registration of the basal ganglia and thalamus by elastic matching (on the
right). Figure
5 represents the 3D displacement of the basal ganglia in the atlas in the
warping process.
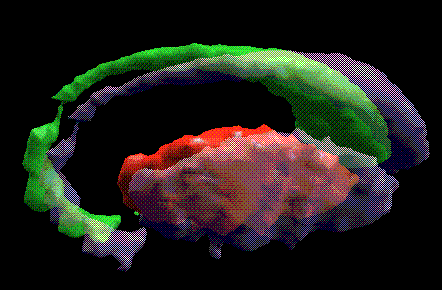
Figure 5: A 3D representation of the right basal
ganglia, taken from the atlas (caudate nucleus = green, putamen = red). Here, we
superimposed (in gray) the final shapes and positions of the basal ganglia after
being warped onto a new brain image.
1.
The Similarity Between Automated and Manual Measurements, when using the
subcortical gray and white matter surfaces as match features: We computed the
similarity coefficients between automated and manual measurements, using the
formula presented in the Methods section. The elastic match was done using the
subcortical gray and white matter surfaces as match features. (See Methods
section for the operational definition of the subcortical gray matter. The
rationale for using subcortical gray matter surface as the primary feature of
the match was to obtain a better result for subcortical structures.) The first
column in Table
1 lists the mean similarity coefficients for whole brain volume and the 10
other brain structures, averaged over 28 cases. The improvement of the results
of the first match during subsequent iterative cycles is highlighted in Table
2 by presenting the results for all four iterations of the elastic match.
After four iterative warping cycles, the similarity coefficients were 97% for
whole brain volume, 97% for whole white matter, 92% for whole gray matter, 96%
for thalamus (both sides), 91% for basal ganglia (93% for putamen, 91% for
caudate nucleus, and 76% for globus pallidus).
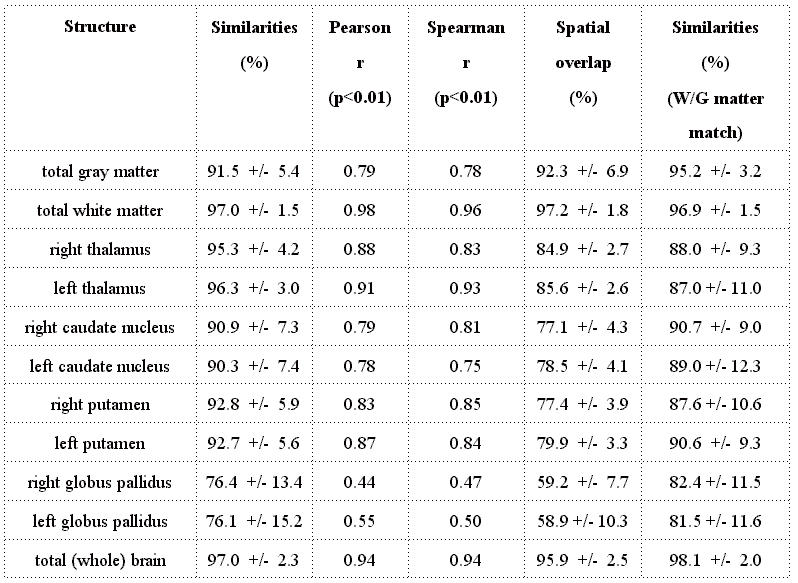
Table
1:Comparison between manual and automated measurements of
brain volumes
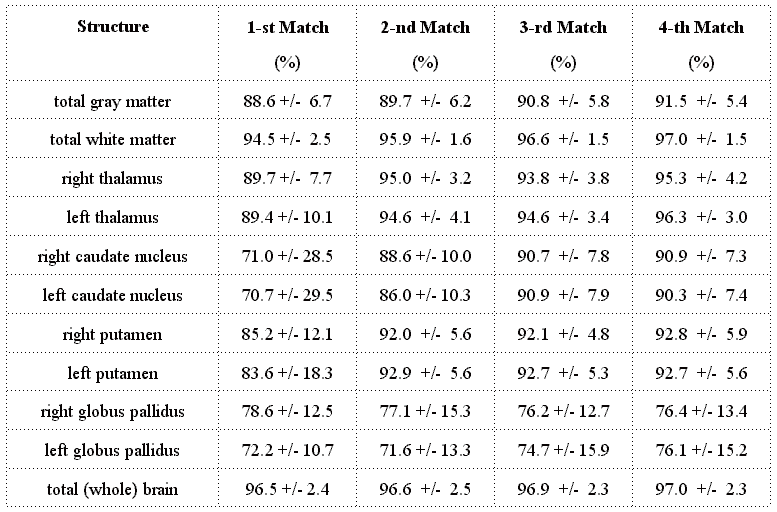
Table 2: Similarity coefficients(subcortical gray matter
used as primary match feature)
2.
The Correlations Between Pairs of Automated and Manual Measurements
(using subcortical gray matter and white matter as match features): Two-tailed
tests of significance were used for the Pearson and the Spearman correlations
between the manual measurements and the results of each of the four cycles of
iterative elastic matching. We averaged the results for all 28 brain images.
Columns 3 and 4 in Table
1 present the Pearson and the Spearman correlations, computed separately for
the 11 neuroanatomical structures. After four iterative warping cycles, the
Pearson correlations between the two data sets were r=.94 for the whole brain,
r=.98 for the white matter, r=.79 for the gray matter, r=.90 for thalamus, and
r=0.79 for basal ganglia ( r=.78 for the caudate nucleus, r=.85 for putamen, and
r=.50 for globus pallidus). All these r values were significant at p <
0.01.
3.
The Spatial Overlap Between Automatically Edited and Manually Edited
Structures (using subcortical gray matter and white matter as match
features): We measured the degree of spatial accuracy of the automated algorithm
by computing, for each separate structure, the relative overlap between the
manual and automated volumes. The relative overlap was computed as the
intersection of the two volumes divided by the manually edited volume. Column 5
in Table
1 presents the mean overlap for each of the 11 structures, averaged over the
28 brain images. The mean overlap was 96% for whole brain , 97% for total white
matter, 92% for total gray matter, 86% for thalamus, 79% for putamen, 78% for
caudate nucleus, and 59% for globus pallidus.
4.
The Similarity Between Automated and Manual Measurements, when using the
subcortical gray and white matter surfaces as match features. We also
measured the volumes of the same structures using the gray and white matter
surfaces as match features for the warping algorithm. Our hypothesis was that we
would obtain a worse result for subcortical structures, since in this case the
algorithm would not be able to recognize precisely their position in the new
brain image and would instead approximate this position. We also expected the
results for the total cortical gray matter to improve, since the algorithm would
specifically take into account cortical gray matter boundaries. The column 6 in
Table
1 presents the mean similarity coefficients for the same 11 brain
structures, averaged over 28 cases. With this method, the similarity
coefficients were 87% for thalamus and 89% for basal ganglia (89% for putamen,
90% for caudate nucleus, and 82% for globus pallidus). Thus, if we compare these
findings to #1, above, the results were as predicted: using total gray matter
instead of subcortical gray matter as the matching feature resulted in a lower
accuracy of the volume measurements for the subcortical gray matter structures
(see Tables
1 and 2).
The only apparent exception are the globus pallidus, but there the differences
between the two methods are not statistically significant, due to the large
standard error.
5.
The Similarity of The Measurements for Cortical Gray Matter Structures.
Our study focused primarily on subcortical brain structures, since we assumed
that cortical gyri, which present significant variability even among normal
brains, would be less reliably measured with elastic matching. The automated
computer algorithm assumes the neuroanatomical variability among subjects to be
a topological invariant. But cerebral gyri frequently split in two in some
subjects, whereas they remain one single structure in others, differences which
cannot be taken into account by the automated registration in its present form.
We tested this assumption by measuring 20 brain cortical and subcortical brain
structures in one brain image. We used the first series of segmentations of the
brain images (white matter, gray matter and CSF). We have found a mean
similarity coefficient of 80% for cortical gyri (91% for the medial frontal
gyri, 83% for orbital gyri, 64% for postcentral gyri, 89% for the superior
parietal gyri, and 83% for the inferior parietal gyri). For the same brain
image, the mean similarity coefficient was 90% for subcortical structures (87%
for thalami, 86% for the caudate nucleus, 95% for putamen, and 78% for globus
pallidus), and 98% for total gray and white matter volumes. Please refer to
Shenton et al [23],
and Wible et al [27]
for the definitions of the cortical gyri and boundaries.
6.
The Comparison of The Brain Structures' Volumes Between The Patient Group and
The Normal Controls. We compared subcortical brain structures measured
with elastic matching between schizophrenia patients and the normal control
group (Table
3). We found no significant difference in total brain volume, total gray
matter total white matter or thalamic MR volume between the two groups. These
findings are in concordance with previous results obtained with manually
measured volumes in the same patient population [17]
and Portas and coworkers, submitted for publication). We found, however, an
16.7% increase in MR volume for the basal ganglia in schizophrenics compared
with normal controls (9.8% increase in caudate nucleus, 20.3% for putamen, and
28.2% for globus pallidus). All differences measured in basal ganglia structures
were statistically significant (Pearson p<0.02), with the exception of the
left caudate nucleus (p=0.08). But this difference also becomes significant
(p=0.03) if we compare the total volume of the two caudate nuclei on both sides,
as it was reported by Hokama et al. [17].
These data are in accordance with the results of Hokama and coworkers' study [17],
where manual definitions of the basal ganglia were done in the same patient
population.
Table 3: Comparison between brain structure's volumes in
schizophrenia(SZ) patients and normal controls(NC) (Significant differences
shown in bold)
DISCUSSION
Using elastic matching, we were
able to measure the volumes of several brain structures with very high accuracy.
The best results were obtained in matching large and regularly shaped objects.
Thus, the best matched structure was the thalamus, relatively large and
egg-shaped. The volume measurements of the thalamus were reproduced with an
accuracy of 96%, and the structure was defined 90% within the boundaries traced
manually. This result is similar to previous studies [6],
[18],
[11],
[15],
which have demonstrated greater similarity in results and reliability for
regularly shaped objects. Any error of the matching algorithm had a larger
impact on smaller structures, since we measured the accuracy of the match
relative to the structure's volume. Therefore, the relatively small globus
pallidus was matched with an accuracy of 80%, and overlapped 50% with the
manually traced structure.
The shape also played an important role in the
accuracy of the match. The putamen and the caudate nucleus were roughly similar
in volume, but we obtained better results for the putamen, a compact structure,
whose volume was measured with an accuracy of 92%, and the structure overlapped
82% with the manually traced contours. On the other hand, the caudate nucleus,
an irregular, tail-shaped structure, had an 90% accuracy in volume measurement
but intersected 70%, as opposed with 82% for putamen, with the manually traced
contours.
A key finding derived from this validation study was that the
specific volumetric differences between schizophrenic brains and the normal
controls were defined in exactly the same way by the automated algorithm and by
manual tracing:
These results correlate with previous studies in the literature and, more
specifically, with the measurements reported by Hokama et al.[17],
based on the same patient population. In our opinion, the ability of the elastic
matching algorithm to recognize and measure subtle volumetric differences
induced by pathology is a powerful argument for the reliability of this method.
This finding also suggests that the small errors introduced by the automated
algorithm are systematic, and therefore do not affect the comparison between
groups.
The automated technique has several major advantages over human
manual tracing of anatomical structures. First, the automated technique is rapid
and efficient. This means that the measurements of multiple structures in one
brain, which would have involved weeks of manual editing, can now be completed
in hours. Second, the method is very reliable, in that the results are 100%
reproducible in a second assessment, due to the method being completely
automated. This result has to be compared with the inherent differences between
successive assessments done by a human rater, and the even larger differences
between different raters. As we determined in this study, these advantages of
the automated method are accompanied by excellent accuracy in
measurement.
The technique also has some limitations, at least in its
present form. The most important limitation is the lower accuracy in measuring
cortical structures, due to the high normal variability of those structures
(though keep in mind that the measurement of these areas was, nonetheless,
highly correlated with the manual measurements of these same regions). Further
refining of the matching algorithm [25]
will allow for better measurements of the cortical structures. Another
limitation is related to the size of the structures to be investigated.
Currently, very small structures, such as globus pallidus (volume = 1 ml.) tend
to be recognized and measured with lower accuracy. Those structures, due to
their small size, can be more accurately traced by the manual rater. Therefore,
the advantages of using an automated elastic matching algorithm are less clear
for very small structures.
The main similarities between Dengler's
algorithm [7],
[22],
which we used, and the techniques used by other research teams include:
APPENDIX: Mathematical Model for Elastic
Matching
The goal of the elastic matching algorithm is to find a 3D
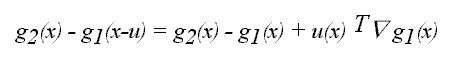
deformation vector field u(x) which transforms the source data set so
that it matches the target data set. Let g1(x) be the source data set
(atlas) and g2(x) be the target data set (patient). The deformation field
u should maximize the local similarity of g1(x-u) and
g2(x). This can be expressed as the problem of finding the deformation
u(x) that minimizes the squared differences between two corresponding
image patches:
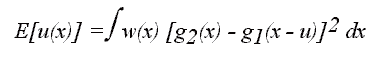
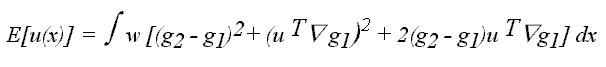
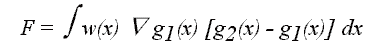
Here w(x) represents a window function that defines a local region
in each data set and is typically chosen to have a Gaussian shape and E
can be regarded as the energy of the deformation field or the error of the
deformation.
A first order Taylor series approximation for the value of
image g1 near x for a locally constant deformation u allows the
difference between the target and source image values to be written as
So the functional to be minimized can be written
Differentiating this expression with respect to u and solving for zero
leads to
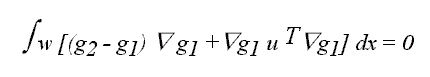
which can be written as
where
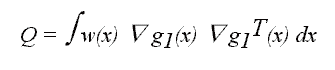
and
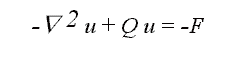
Equation
1 is the estimation part of the functional. In order to regularize the
equation a 3D elastic membrane smoothness constraint is introduced, leading to
the model for the elastic matching
A FEM discretization of the model leads to a system of equations which
are efficiently solved with a nested multigrid algorithm [7],
[22].
The source and target data volumes are converted into a multiresolution pyramid.
At the coarsest resolution the deformation field is assumed to be zero and the
system of equations is solved. The resulting deformation field is then
interpolated (with linear interpolation) to the next higher resolution where it
is used as the initial deformation field and the system of equations is solved
again. This procedure is repeated up to the finest resolution level.
The
model is also valid for features calculated from the source and target data
sets. Directly using the grey scale values of the image data can lead to
problems caused by sensitivity to noise and contrast changes in the data.
Instead the data is first classified with a robust multispectral statistical
classification algorithm [25],
and the tissue class data is used for matching. This improves the robustness of
the algorithm to noise and makes possible an increase in the speed of the
matching.
REFERENCES
[1] Andreasen
NC, Rajarethinam R, Cizadlo T, Arndt S, Swayze VW, Flashman LA, O'Leary DS,
Ehrhardt JC, Yuh WTC. 1996. Automatic atlas-based volume estimation of human
brain regions from MR images J Comput Assist Tomogr.
20(1):98-106.
[2] Bajcsy R and Kovacic S. 1989.
Multiresolution elastic matching. Comp. Vision, Graphics and Image Proc.
46:1-21.
[3] Christensen GE, Rabbitt RD, and Miller
MI. 1993. A deformable neuroanatomy textbook based on viscuous fluid mechanics.
Proc. of the 27th Annual Conf. on Info. Sci. and Sys., Baltimore,
211-216.
[4] Collins DL, Peters TM, Dai W, and Evans AC.
1992. Model based Segmentation of Individual Brain Structures from MRI Data.
SPIE , Visualization in Biomedical Computing 1808:10-23.
[5] Collins DL, Neelin P, Peters TM, Evans AC. 1994. Automatic 3D
intersubject registration of MR volumetric data in standardized Talairach space.
J Comput Assist Tomogr. 18(2):192-205.
[6]
Dann R, Hoford J, Kovacic S, Reivich M, and Bajcsy R. 1989. Evaluation of
elastic matching systems for anatomic (CT,MRI) and functional (PET) cerebral
images. J Comput Assist Tomogr. 13(4):603-611.
[7] Dengler J, Schmidt M. 1988. The Dynamic Pyramid - A Model for
Motion Analysis with Controlled Continuity. International Journal of Pattern
Recognition and Artificial Intelligence, 2:275-286.
[8] Dhawan AP, Arata L. 1992. Knowledge-based
multi-modality three-dimensional image analysis of the brain Am. J. of
Physiol. Imag. 7(3-4):210-219.
[9]
Ettinger GJ, Grimson WEL, Lozano-Perez T, Wells WM, White SJ, and Kikinis R.
1994. Automatic registration for multiple sclerosis change detection. Proc.
IEEE, Biomed. Image Anal. 297-306.
[10] Evans AC, Dai
W, Collins L, Neelin P, and Marett S. 1991. Warping of a computerized 3D atlas
to match brain images volumes for quantitative neuroanatomical and functional
analysis. Image Processing 1445:236-246.
[11] Gee JC, Reivich M, and Bajcsy R. 1993. Elastically deforming
3D Atlas to Match Anatomical Brain Images. J Comput Assist Tomogr.
17:225-236.
[12] Gerig G, Kubler O,Kikinis R, and
Jolesz FA. 1992. Nonlinear Anisotropic Filtering of MRI Data. IEEE TMI,
11:221-232.
[13] Grenander U and Miller MI. 1994.
Representation of knowledge in complex systems J. of the Royal Stat.
Society B 56 (3).
[14] Haller JW, Christensen GE,
Miller MI, Joshi SC, Gado M, Csernansky JG, Vannier MW. 1995. Comparison of
automated and manual segmentations of hippocampus MR images. Proc. SPIE.
Medical Imaging 1995: Image Processing, 2434:206-215.
[15] Haller JW, Banerjee A, Christensen GE, Gado M, Joshi S, Miller
MI, Sheline Y, Vannier MW, and Csernansky JG. 1997. Three-dimensional
Hippocampal MR Morphometry with High- dimensional Transformation of a
Neuroanatomic Atlas. Radiology, 202:504-510.
[16] Höhne KH, Bomans M, Riemer M, Schubert R, Tiede U, Lierse WA.
1992. 3D anatomical atlas based on a volume model. IEEE Comput. Graphics
Appl. 12:72-78.
[17] Hokama HH, Shenton ME,
Nestor PG, Kikinis R, Levitt JJ, Metcalf D, Wible CG, O'Donnell BF, Jolesz FA,
McCarley RW. 1995. Caudate, putamen and globus pallidus volume in schizophrenia:
A quantitative MRI study. Psychiatry Res: Neuroimaging,
61:209-229.
[18] Kikinis R, Shenton ME, Gerig G,
Martin J, Anderson M, Metcalf D, Guttmann CRG, McCarley RW, Lorensen W, Cline H,
Jolesz FA. 1992. Routine quantitative analysis of brain and cerebrospinal fluid
spaces with MR imaging. Journal of Magnetic Resonance Imaging
2:619-629.
[19] Kikinis R, Shenton ME, Iosifescu
DV, McCarley RW, Saiviroonporn P, Hokama HH, Robatino A, Metcalf D, Wible CG,
Portas CM, Donnino RM, Jolesz FA. 1996. A digital brain atlas for surgical
planning, model driven segmentation, and teaching. IEEE: Visualization and
Computer Graphics 2(3): 232-241.
[20] Kikinis
R, Gleason L, Moriarty TM. 1996. Computer-assisted Interactive Three-dimensional
Planning for Neurosurgical Procedures. Neurosurg.
38(4):640-649.
[21] Miller MI, Christensen GE,
Amit Y, and Grenander U. 1993. Mathematical textbook of deformable
neuroanatomies. Proc. of the Nat. Acad. of Sci.
90:11944-11948.
[22] Schmidt M, Dengler J. 1989.
Adapting Multi-Grid Methods to the Class of Elliptic Partial Differential
Equation Appearing in the Estimation of Displacement Vector Fields. In: V.
Cantoni, R. Creutzburg, S. Levialdi, and H. Wolf, eds. Recent Issues in
Pattern Analysis and Recognition, Lecture Notes in Computer Science. pp.
266-274. Springer, Berlin-Heidelberg-New York-Tokyo.
[23]
Shenton ME, Kikinis R, Jolesz FA, Pollak SD, LeMay M, Wible CG, Hokama H, Martin
J, Metcalf D, Coleman M, McCarley RW. 1992. Abnormalities of the left temporal
lobe and thought disorder in schizophrenia: a quantitative magnetic resonance
imaging study. N.Engl.J.Med. 327:604-612.
[24] Shenton ME, Kikinis R, McCarley RW, Saiviroonporn P, Hokama
HH, Robation A, Metcalf D, Wible CG, Portas CM, Iosifescu DV, Donnino R,
Goldstein JM, Jolesz FA. 1995. Harvard Brain Atlas: A Teaching and Visualisation
Tool. Proc. IEEE, Biomed. Image Anal. 10-17.
[25]
Warfield S, Dengler J, Zaers J, Guttmann CRG, Wells WM, Ettinger GJ, Hiller J,
Kikinis R. 1996. Automatic Identification of Gray Matter
Structures from MRI to Improve the Segmentation of White Matter Lesions.
Journal of Image Guided Surgery, 1995, 1(6):326-338.
[26] Wells WM, Grimson WEL, Kikinis R, Jolesz FA. 1996. Statistical
intensity correction and segmentation of MRI data. IEEE TMI.
15(4):429-443.
[27] Wible CG, Shenton ME, Hokama
H, Kikinis R, Jolesz FA, Metcalf D, McCarley RW. 1995. Prefrontal cortex and
schizophrenia: A quantitative magnetic resonance imaging study. Arch Gen
Psychiatry
52:279-288.