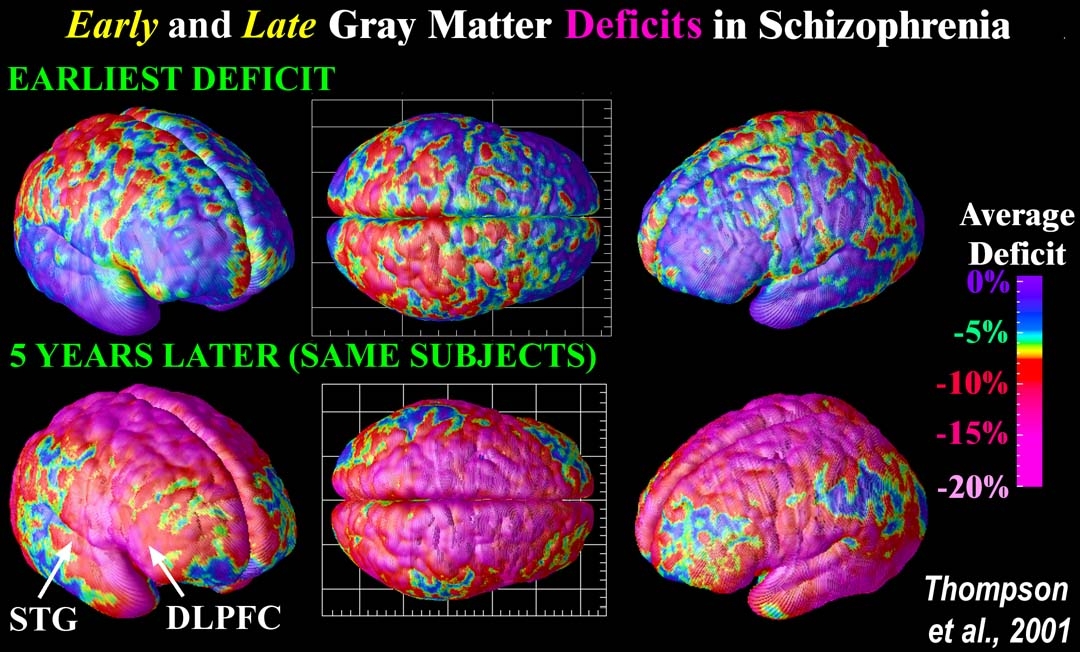
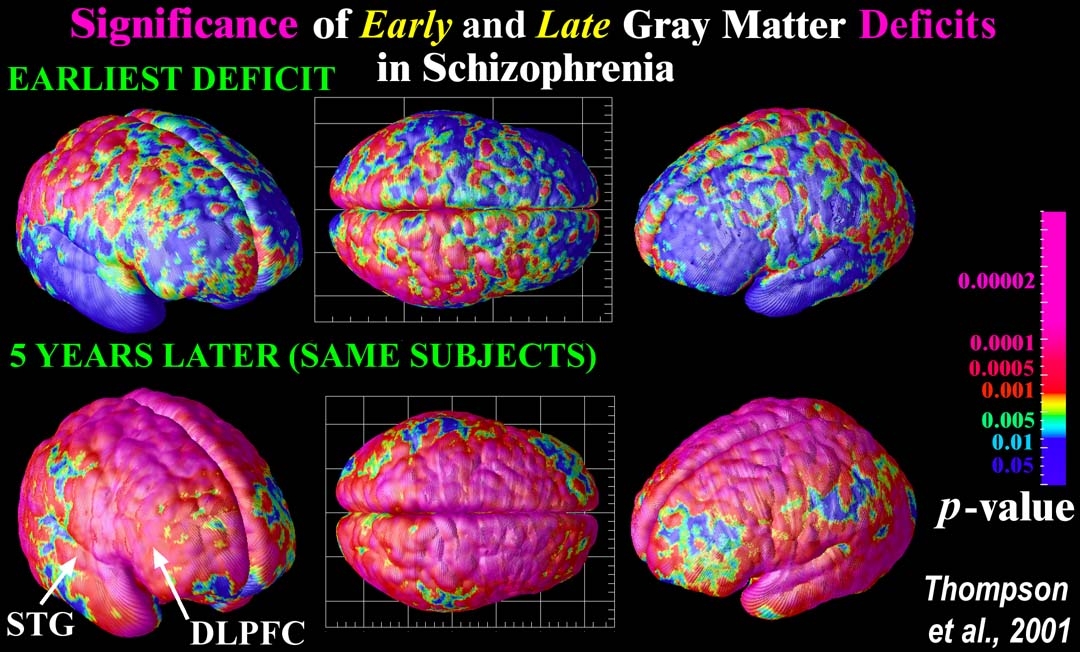
Figure 1. Rates of Gray Matter Loss in Normal Adolescents and Matched Subjects with Schizophrenia (All Males and Females Pooled). [Larger Image] Figure 2. Maps of Significant Progressive Gray Matter Loss in Normals, Schizophrenic Patients, and Significant Group Differences (All Males and Females Pooled). [Larger Image] Figure 3. Patterns of Gray Matter Loss are Replicated in Males and Females Averaged Separately. Rates of Adolescent Gray Matter Loss in Normal Boys, Normal Girls, and Matched Schizophrenic Subjects. [Larger Image] Figure 4. Regions where Loss Rates Depend on Age (Faster when Younger vs. Faster when Older). Significance of Nonlinear Loss. [Larger Image] Figure 5. Regions with Earliest Gray Matter Deficits in Schizophrenia (Time 1 Subtraction). Percentage and Significance of Deficits. [Larger Image]
Maps of Significant Progressive Gray Matter Loss in Schizophrenia (All Males and Females Pooled) Maps of Significant Progressive Gray Matter Loss in Schizophrenia (Females Only) Maps of Annual Percentage Loss in Gray Matter (Males) Same, with Left hemisphere also shown [NEW] Maps of Significance of Annual Percentage Loss in Gray Matter (Males) Same, with Left hemisphere also shown Maps of Significance of Annual Percentage Loss in Gray Matter (Females) [NEW] Group Differences: Regions with Significantly Greater Rates of Gray Matter Loss in Schizophrenia (Males) Group Differences: Regions with Significantly Greater Rates of Gray Matter Loss in Schizophrenia (Males and Females Shown Separately) [NEW]

![[Larger Image]](http://www.loni.ucla.edu/~thompson/J/1_PERC_comp_6PANELS.gif)
![[Larger Image]](http://www.loni.ucla.edu/~thompson/J/2_P_COMP_nv_sch_diff.gif)
![[Larger Image]](http://www.loni.ucla.edu/~thompson/J/3_PERC_GENDER.gif)
![[Larger Image]](http://www.loni.ucla.edu/~thompson/J/4_NONLINEAR_loss.gif)
![Same, with Left hemisphere also shown [NEW]](http://www.loni.ucla.edu/~thompson/J/PERC_comp_6PANELS.gif)
![Maps of Significance of Annual Percentage Loss in Gray Matter (Females) [NEW]](http://www.loni.ucla.edu/~thompson/J/P_comp_6PANELS_FEMALES.gif)
![Group Differences: Regions with Significantly Greater Rates of Gray Matter Loss in Schizophrenia (Males and Females Shown Separately) [NEW]](http://www.loni.ucla.edu/~thompson/J/P_comp_GROUP_DIFF_M_F.gif)